SitUnit
One page for the morning check.
Hazards and impacts for your county, with the time each one was updated.
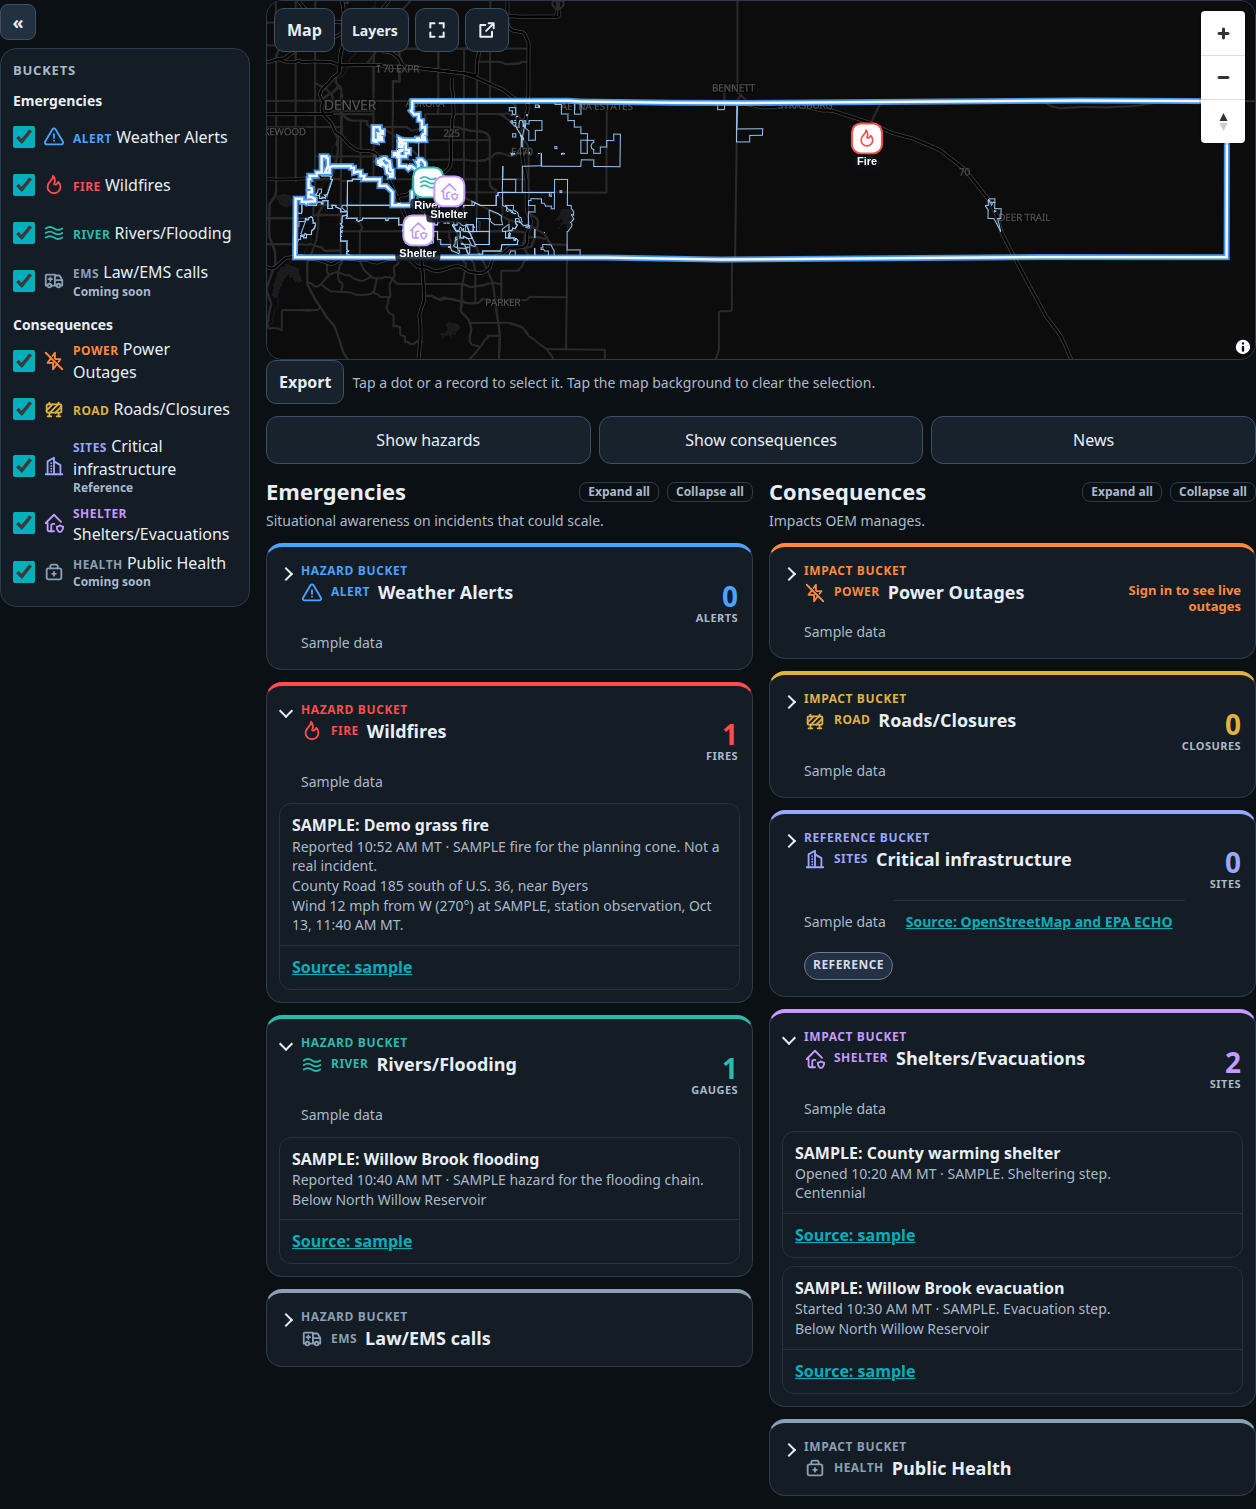
Your county, set once
Pick your county once. SitUnit remembers it. Share a link and your team opens the same view.
Ready for the brief
Save the map and lists as an image or PDF in one step. Share it with leadership or partners.
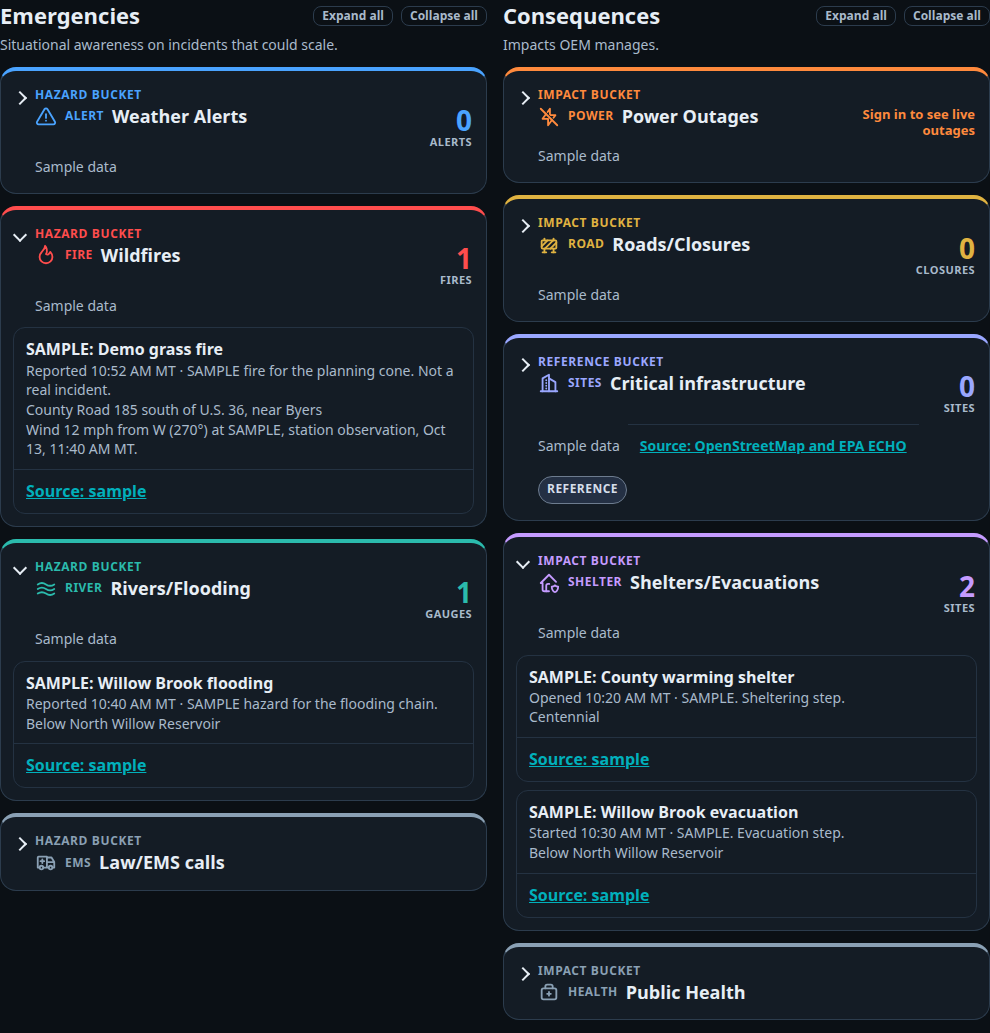
Hazards and impacts, side by side
Hazards are on the left. Impacts, like roads, power, and shelters, are on the right. Each item shows when it was last updated. If something stops updating, you see that too. No false all clear.
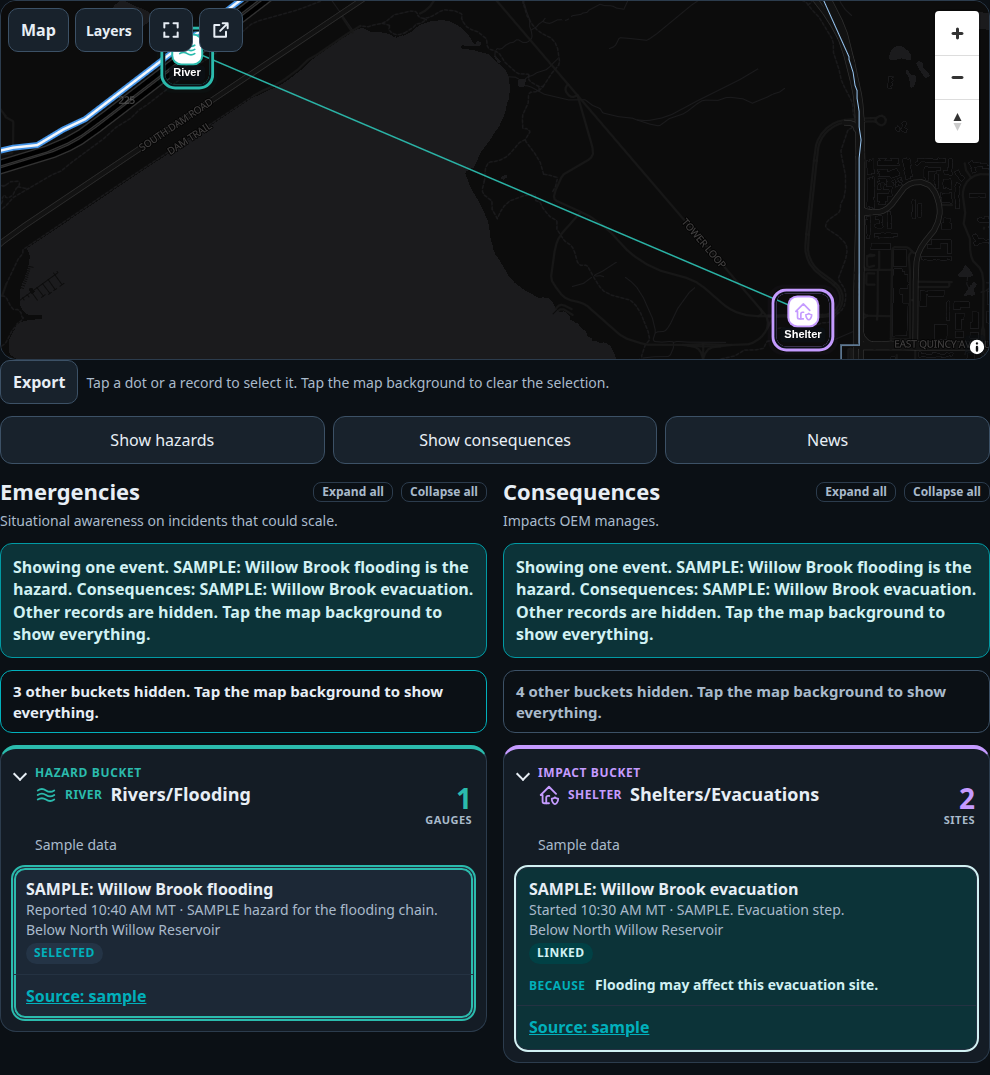
Tap a hazard to see the whole event.
Tap a hazard and the page shows that event, the impacts tied to it, and the lines on the map. Each link has a plain reason it is there. Tap the map background to see everything again.
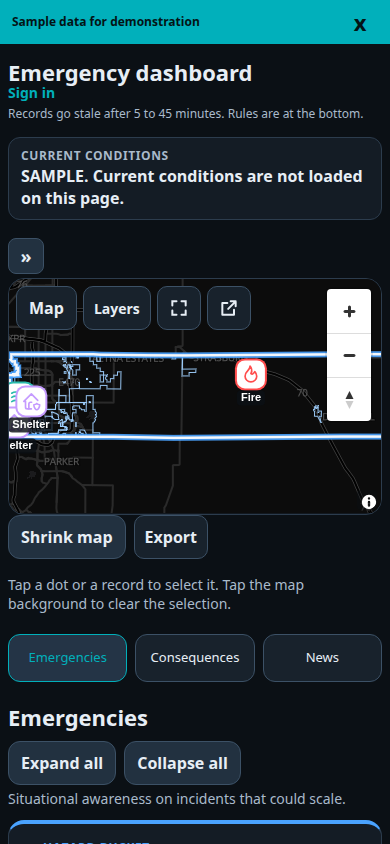
Works on your phone and the EOC wall.
Open the same page at your desk, on your phone, or on the wall in the EOC.